Recently ARM presented Class 5 of its Design Webinar Series, which was focused on material properties, as they relate to product design. The webinar consisted of an initial presentation by ARM’s Technical Director Dr Nick Henwood, followed by a series of questions from Michael Paloian of Integrated Design Systems, the regular presenter of the Design Series.
As a highly experienced designer, Michael’s questions were extremely searching and got into some interesting and relevant detail, so we thought that it would be useful to fully reproduce the conversation between him and Nick below.
For those who missed the live event, a recording of Nick’s complete presentation is now available in the Members’ Area of the ARM website along with Michael’s entire series on rotational molding design.
Michael Paloian:
If creep is tested for a particular grade of polyethylene, how dependent is the data on processing conditions? For example, it’s known that cooling rate will affect the percent crystallinity achieved, which may in turn affect creep rate. Is this a serious concern?
Nick Henwood:
The answer is yes and no, I guess.
Mike is absolutely correct that the rate of cooling affects the amount of crystallinity that develops in polyethylene. In the lab, you can certainly increase or decrease the crystallinity by manipulating the rate of cooling. However, the good news is that for the sort of cooling rates that we use in rotomolding, the variations in crystallinity are relatively small. So, in terms of having to worry about whether one sample was cooled a little bit faster or slower than another one, that’s probably not a major concern in this case.
What’s certainly important is that you use samples for creep testing that have been cooled at a rate similar to that encountered in rotomoulding. Of course, you could use rotomolded samples, but the problem is that, as any rotomolder will tell you, you can get a considerable thickness variation within a rotomolded part. So, with rotomolded samples, it may be difficult to get samples that you can test that are all precisely a given thickness. This can make test-to-test comparisons problematic. The compromise that I use in my lab is to compression mold my creep samples, but to make sure that they are cooled at a rate typical of rotomoulding conditions. I’ve developed a technique to do this consistently. Compression molding has the benefit that you can accurately control sample thickness.
Michael Paloian:
Is creep rate in polyethylene affected by stabilizers and pigments?
Nick Henwood:
A very good question and the truthful answer is that I don’t know for certain.
In terms of additives, I think that you probably wouldn’t see a big difference in creep performance, provided that you didn’t overcook the part in the first place.
However, it’s important to recognize that a part that starts life being overcooked may well show reduced life in terms of some other long-term properties, like UV resistance. Overcooking promotes degradation reactions that release free radicals, which promote more degradation (both temperature-induced and UV-induced). The antioxidants that are incorporated into roto grade polymers soak up these free radicals, up to a certain point, but overcooking will eventually exhaust them.
In terms of pigments, it’s well understood that dry blended pigments have an effect on short-term properties, particularly impact strength. If you need more details on this, there’s an article on the subject, in the latest RotoWorld Magazine. It’s likely that dry blended pigment agglomerates could form a defect in the material, which could be a source of micro-crack growth long-term. You could then expect some effects on creep performance. I wouldn’t expect anything significant for materials where the pigment had been compounded in.
It’s also worth noting that there are pigments (particularly blues and greens) that may promote extra crystallization in PE. So it’s possible that the creep performance of (even compounded) blue / green product might be a bit different than natural. That’s certainly a factor so, if your products are going to be a particular shade of blue or green, it would make a lot of sense to do some specific creep testing.
Michael Paloian:
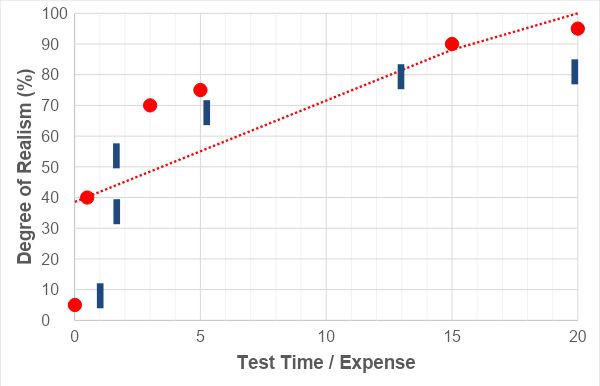
The next question is about the “realism versus time/cost graph that you showed related to long-term testing (this is displayed below, for reference). Based on your graph, I see that only 5% of realism associated with accelerated testing methods. Does this mean the results are only 5% valid? If not, what do you mean by “realism”?
Nick Henwood:
Another excellent question. As I said when I introduced this graph, it’s purpose is to indicate a trend. In truth, I’ve got no way of justifying the precise numbers for any type of testing. However, I would defend the basic premise of the graph. The more that you accelerate a test, the less connection it has to realistic conditions. When you use highly accelerated lab testing conditions, it’s important to question how valid the conclusions are; sure, you’ve got a number, but does it mean anything in the real world?
Take the Environmental Stress Crack resistance (ESCR) test as an example of what I mean. For those not acquainted with the test details, you put your sample through a living hell! You scratch a notch in the sample bar. You bend the sample bar in a way that generates a big stress in the notch area. You pretty much double the ambient temperature and you immerse the sample bar in a highly invasive, highly aggressive (to PE) test solution. You are likely to get failures, lots of them; the test conditions stipulated make sure of it.
In my view, the best you can say about accelerated lab testing is that it may give you a useful differentiation between one grade and another. And that is honestly as good as it gets. Possibly some of my colleagues in the material testing area would think this was heresy, or an exaggeration, but that’s my general experience of highly accelerated lab tests.
The main point is that, as in all scientific investigation, just having a number is not the complete answer. You should always ask yourself: how valid is this number? How realistic is this number? How much reliance should I put on this number? There are no easy answers to these questions, but the important thing is to realise that there will always be doubt. It’s rarely as simple as: “Okay. Computer says yes, I’m in the clear.” Unfortunately real life’s not like that!
Michael Paloian:
Are UV resistance and fading property losses linear with time, or do they follow some accelerated, parabolic or log curve? (The graph shown in the presentation is displayed below, for reference).
Nick Henwood:
Well, in terms of UV attack… the graph I’ve shown relates to a typical rotomolding “tank” grade. In this case, the drop in tensile properties certainly looks pretty linear, which has justified extrapolating the line down to 50% elongation loss and stating a 12,500 hr result (ie a “UV12” rating).
I’ve seen similar graphs that aren’t linear… sometimes you see very little drop-off initially and then the line drops more steeply. For example, if you dry blend the UV additive (instead of compounding it), you’ll get what appears to be good protection at first (maybe for the first 1- 2,000 hours), but then the line drops like a stone. Definitely not recommended!
Another good question in relation to UV stability is this: what does 12,000 hours in an accelerated weathering chamber mean in real life exposure? In my experience, you’ll struggle to get anyone to hang their hat on a correlation! In view of our litigious society, I suspect that the lawyers are busy telling everyone that they shouldn’t give you a definitive answer.. and I do see their point!
People have told me, off the record, that UV12 indicates 12 years of real exposure, but this definitely depends whether you are in Alaska or Arizona. What you can say is that a grade that takes 12,000 hours to get down to 50% drop is highly likely to withstand UV attack better than a grade where the line is steeper and reaches 50% drop in 5,000 hours.
For UV testing, there is considerable data that indicates that the accelerated testing has a reasonable correlation with longer term testing.
Michael Paloian:
Is creep rate dependent upon molecular weight or molecular weight distribution?
Nick Henwood:
I would say that the jury is out about some aspects of this; actually that’s something I’m looking at in my own creep test program.
I would expect that low Melt Index materials should perform better in later stages of creep deformation. My general advice would be that, if the density is exactly the same, it will generally help long-term properties if you decrease the MI of the polymer. As you probably know, decrease in the MI of the polymer means you’ve got a higher average molecular weight; essentially, the molecules are longer and they tend to get more entangled with each other. When stresses are applied, it’s harder for the individual molecules to untangle from each other, which effectively provides a greater resistance to creep.
Actually, for lots of reasons, other than creep, a low MI (which signifies a relatively high molecular weight), is going to help with long term properties.
As far as molecular weight distribution, I haven’t seen any published studies on that for PE roto grades. On a practical note, molecular weight distribution is a property for linear PE that you can’t alter once the polymer’s made, it is what it is. Polymer companies use different catalysts to get different types of molecular weight distribution, for different applications. The molecular weight distribution used in typical rotomolding grades is usually a broad to medium type of molecular weight distribution.
Michael Paloian:
The UV test is based on tensile loss. Can one assume the same percent loss would also be other properties such as impact and modulus, or would the modulus increase because of embrittlement?
Nick Henwood:
I think that the main reason tensile tests are used with this sort of UV testing is convenience. Tensile bars are pretty small items, so you can pack a lot of tensile bars in a given area of an accelerated test chamber. I would expect a reasonable correlation between tensile results and flexural results, because they’re dependent on the same things in the PE…. degree of crystallinity.
In terms of impact strength, this is not directly related to tensile properties. Impact strength, as measured by the ARM test, is a typical short term property of the material.
If your sample has been subjected to long-term degradation (eg from UV attack), you could realistically expect that there will be some influence on impact strength. The effect could be quite significant, because an impact is a very good way of ferreting out micro defects in the material. So, if you’ve got a sample that is severely UV degraded, you might see an even bigger loss in impact strength than you do in tensile of flexural modulus.
Michael Paloian:
You mentioned that the ESCR test is extreme. How does one interpret the extreme conditions to long-term properties based on more realistic conditions?
Nick Henwood:
I think there’s a couple of things to say about this.
The test result from the ASTM ESCR “bent strip” test is basically “how long does it take for 10 identical sample strips to fail?”. Actually, you often get some early failures and some later ones, they don’t necessarily all fail at once. The ASTM protocol gives you a method to work out an “average” failure value. You can compare this value for one grade against the value for an alternative grade.
The ESCR test is terminated at 1,000 hours, unless all replicates fail at an earlier time. You don’t go on to 2,000 or 3,000 or 4,000 hours, because by the time 1,000 hours have taken place, the stresses that you induced in the samples at the start of the tests have pretty much fully relaxed. In other words, if none of the samples have failed after 1000 hours, they’re not going to.
So 1,000 hours is a very good result, “as good as it gets”. In this statement, I’m referring to the most aggressive environment (there are actually two different environments specified in ASTM). One is more aggressive than the other. So if we’re talking about the most aggressive condition (10% Igepal), 1,000 hours is an “excellent” result. Some of our best linear tank grades, will give you 1,000 hours, at the 10% condition.
Toy grades, which are not aimed at high ESCR applications, will have a much lower values: you’ll maybe only get values of 20-50 hours. Very short. Although I wouldn’t label these as bad materials per se, they are unsuitable grades for product applications subjected to long-term stresses. If you’re worried about long term properties, don’t use a toy grade; that’s not what it’s designed for.
So ESCR numbers below 100 hours indicate materials that are unlikely to have good long-term properties. 1,000 hours is excellent. And 500 hours plus is a pretty good number. Really, that’s as good a differentiation between grades as you can achieve. If one supplier’s data sheet shows 80 hours and another supplier shows 100 hours, there’s effectively no difference; the measured test variability is such that that that such differences don’t mean anything. So my advice would be to view the numbers as indicating, from an ESCR point of view: “bad.. good.. or excellent”. That’s about the most you can get out of the ASTM bent strip ESCR test.
Actually, I am doing some work with another institution to look at whether we could come up with an ESCR test that gave you more reliable data, ie data where smaller differences actually signified something realistic. There are some alternative “ESCR” tests, used not in rotomolding but in the geomembrane area, that could hold promise. Obviously the geomembrane boys, who are producing liners for reservoirs, need to be super-worried about long term properties also.
ARM, as an association, did try to develop an alternative to the bent strip ESRC test; same basic idea, but a different way of applying the stress. We had high hopes for this work; ExxonMobil and Nova were both heavily involved and invested their time and resources to try to give us more realistic, more reliable numbers. However, the end conclusion was that, unfortunately, the data variability for the new test was not dramatically better than the existing test.
As a final thought, as I said in the presentation, ESCR is currently the only long-term test that’s shown on your standard technical the data sheet. Maybe that’s something we should look at because we’re an industry where people make things to last; so long term properties can be really important.
Michael Paloian:
In the presentation, you mentioned the fatigue resistance and ESCR benefits of cross-link. I would assume cross-link might also perform much better than conventional polyethylene in resisting creep.
Nick Henwood:
I think you’re dead right Mike, but I haven’t seen any test work on that. Although crosslink PE isn’t necessarily a lot stiffer than some conventional linear PE grades, it does tend to be a lot tougher. Plus it has outstanding ESCR.
Going back to my original description of PE morphology – the different crystalline and amorphous areas present in PE – I believe that the main creep deformations (movements under long-term applied stress) will take place in the amorphous areas. When molecules in the amorphous areas are subjected to stress over a long enough time, they start to slip over each other.
With crosslinked PE, pretty much all the individual molecules are bonded together by side links, so you’ve created a network structure. I suspect that, when the stress is initially applied, you’ll get a similar initial deflection as to equivalent density linear PE’s. But then my assumption would be that the long-term deflection (aka the creep) will increase more slowly over time. I’m not aware of any publicly available data out there that would prove my assumptions. This would certainly be something worth looking at, because I think Mike’s on the right track.
Leave a Reply